Plant Dust Map
Ea commodo exercitation commodo, proident
cillum, do reprehenderit consequat et eu
anim voluptate. Ut cupidatat
reprehenderit in dolor labore.


Plant Dust Map
 Technology Coaching can help you making the right decisions related to reducing dust by:
1.
Analysing your plant and generating a dust map (Including Relative Humidity and Temperature)
2.
Identifying the sources of dust creation and spreading of dust
3.
Support in making the right investments to reduce dust
Please contact Technology Coaching if you want more information or a quotation.
Technology Coaching can help you making the right decisions related to reducing dust by:
1.
Analysing your plant and generating a dust map (Including Relative Humidity and Temperature)
2.
Identifying the sources of dust creation and spreading of dust
3.
Support in making the right investments to reduce dust
Please contact Technology Coaching if you want more information or a quotation.
Dust is one of the key problems in production. It is not only resulting in frequent
stops to resolve print defects due to dust but also can be dangerous in relation to
dust explosions. TC now offers the service making a plant dust map.
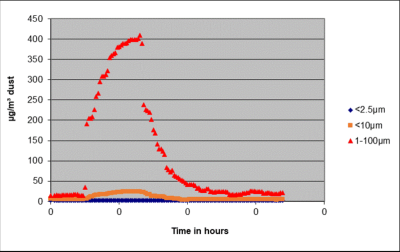
Plant dust map: 1. Sensors counting dust particles are used for dust particle sizes of: 1. <2µm 2. <10µm 3. between 1-100µm 2. Measuring locations are defined based on the plant lay-out. Remote Data Sensing is used to store the data 3. Dust levels are measured using a test protocol. 4. A report is provided showing the dust levels in the plant and the key creators and spreaders of dust. 5. Support is provided to help reducing dust levels. The graph provides information about the sensor sensitivity. A paper tissue was waved in front of the sensors while taking every second a reading for dust particle count. Following graph is life recorded.
Technology Coaching can help you making the right decisions related to reducing dust by:
1.
Analysing your plant and generating a dust map (Including Relative Humidity and Temperature)
2.
Identifying the sources of dust creation and spreading of dust
3.
Support in making the right investments to reduce dust
Please contact Technology Coaching if you want more information or a quotation.